Additional information
| Weight | 1 kg |
|---|---|
| Dimensions | 11 × 11 × 11 cm |
| Shipping Time | 1-2 weeks |
Original price was: ₹2,399.00.₹1,919.00Current price is: ₹1,919.00.
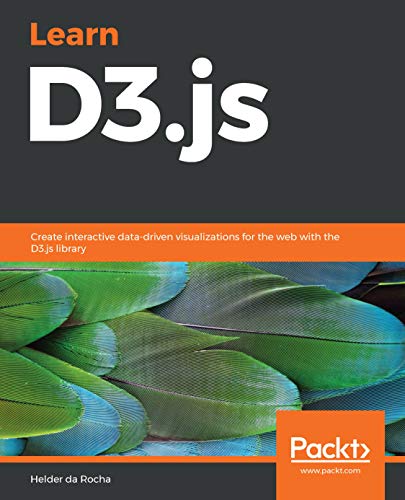
This book is a practical hands-on introduction to D3 (Data-driven Documents): the most popular open-source JavaScript library for creating interactive web-based data visualizations. Based entirely on open web standards, D3 provides an integrated collection of tools for efficiently binding data to graphical elements. If you have basic knowledge of HTML, CSS and JavaScript you can use D3.js to create beautiful interactive web-based data visualizations.
D3 is not a charting library. It doesn’t contain any pre-defined chart types, but can be used to create whatever visual representations of data you can imagine. The goal of this book is to introduce D3 and provide a learning path so that you obtain a solid understanding of its fundamental concepts, learn to use most of its modules and functions, and gain enough experience to create your own D3 visualizations. You will learn how to create bar, line, pie and scatter charts, trees, dendograms, treemaps, circle packs, chord/ribbon diagrams, sankey diagrams, animated network diagrams, and maps using different geographical projections. Fundamental concepts are explained in each chapter and then applied to a larger example in step-by-step tutorials, complete with full code, from hundreds of examples you can download and run.
This book covers D3 version 5 and is based on ES2015 JavaScript.
The book is intended for web developers, web designers, data scientists, artists, and any developer who wish to create interactive data visualization for the Web using D3. The book assumes basic knowledge of HTML, CSs, and JavaScript.
| Weight | 1 kg |
|---|---|
| Dimensions | 11 × 11 × 11 cm |
| Shipping Time | 1-2 weeks |
Only logged in customers who have purchased this product may leave a review.
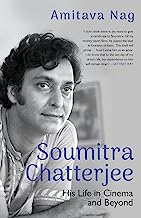 SOUMITRA CHATTERJEE HIS LIFE IN CINEMA AND BEYOND
Original price was: ₹499.00.₹349.00Current price is: ₹349.00.
SOUMITRA CHATTERJEE HIS LIFE IN CINEMA AND BEYOND
Original price was: ₹499.00.₹349.00Current price is: ₹349.00.
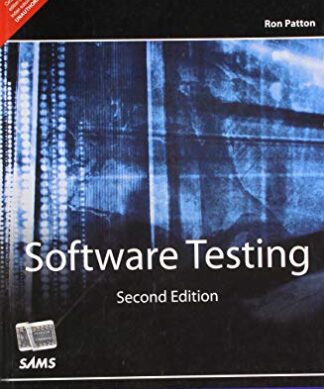 Software Testing, 2e
₹557.00
Software Testing, 2e
₹557.00
 Ethically hacking an industrial control system: Analyzing, exploiting, mitigating, and safeguarding industrial processes for an ethical hacker (English Edition) Paperback – 30 March 2022
Original price was: ₹799.00.₹639.00Current price is: ₹639.00.
Ethically hacking an industrial control system: Analyzing, exploiting, mitigating, and safeguarding industrial processes for an ethical hacker (English Edition) Paperback – 30 March 2022
Original price was: ₹799.00.₹639.00Current price is: ₹639.00.
 SRI VENKATESHWARA SWAMI (TELUGU) by Srinivas Sevanand Das 2025 Hardbound
Original price was: ₹999.00.₹750.00Current price is: ₹750.00.
SRI VENKATESHWARA SWAMI (TELUGU) by Srinivas Sevanand Das 2025 Hardbound
Original price was: ₹999.00.₹750.00Current price is: ₹750.00.
 SRI VENKATESHWARA SWAMI (TELUGU) by Srinivas Sevanand Das 2025
Original price was: ₹399.00.₹250.00Current price is: ₹250.00.
SRI VENKATESHWARA SWAMI (TELUGU) by Srinivas Sevanand Das 2025
Original price was: ₹399.00.₹250.00Current price is: ₹250.00.
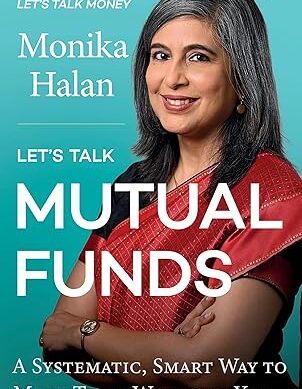 Let's Talk Mutual Funds
Original price was: ₹399.00.₹319.00Current price is: ₹319.00.
Let's Talk Mutual Funds
Original price was: ₹399.00.₹319.00Current price is: ₹319.00.
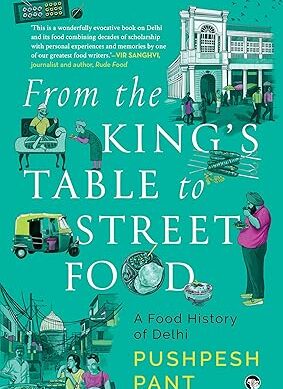 From The King’s Table to Street Food : A Food History of Delhi
Original price was: ₹699.00.₹559.00Current price is: ₹559.00.
SRI VENKATESHWARA SWAMI (TELUGU) by Srinivas Sevanand Das 2025 Hardbound
Original price was: ₹999.00.₹750.00Current price is: ₹750.00.
SRI VENKATESHWARA SWAMI (TELUGU) by Srinivas Sevanand Das 2025
Original price was: ₹399.00.₹250.00Current price is: ₹250.00.
Let's Talk Mutual Funds
Original price was: ₹399.00.₹319.00Current price is: ₹319.00.
From The King’s Table to Street Food : A Food History of Delhi
Original price was: ₹699.00.₹559.00Current price is: ₹559.00.
From The King’s Table to Street Food : A Food History of Delhi
Original price was: ₹699.00.₹559.00Current price is: ₹559.00.
SRI VENKATESHWARA SWAMI (TELUGU) by Srinivas Sevanand Das 2025 Hardbound
Original price was: ₹999.00.₹750.00Current price is: ₹750.00.
SRI VENKATESHWARA SWAMI (TELUGU) by Srinivas Sevanand Das 2025
Original price was: ₹399.00.₹250.00Current price is: ₹250.00.
Let's Talk Mutual Funds
Original price was: ₹399.00.₹319.00Current price is: ₹319.00.
From The King’s Table to Street Food : A Food History of Delhi
Original price was: ₹699.00.₹559.00Current price is: ₹559.00.
 Indistractable How to Control Your Attention and Choose Your Life Paperback – 20 Sep 2019
Original price was: ₹599.00.₹399.00Current price is: ₹399.00.
Indistractable How to Control Your Attention and Choose Your Life Paperback – 20 Sep 2019
Original price was: ₹599.00.₹399.00Current price is: ₹399.00.
 Loonshots: How to Nurture the Crazy Ideas That Win Wars, Cure Diseases, and Transform Industries Hardcover – 19 Mar 2019
Original price was: ₹599.00.₹429.00Current price is: ₹429.00.
Loonshots: How to Nurture the Crazy Ideas That Win Wars, Cure Diseases, and Transform Industries Hardcover – 19 Mar 2019
Original price was: ₹599.00.₹429.00Current price is: ₹429.00.
 Factfulness (English, Hardcover, Hans Rosling)
Original price was: ₹499.00.₹349.00Current price is: ₹349.00.
Factfulness (English, Hardcover, Hans Rosling)
Original price was: ₹499.00.₹349.00Current price is: ₹349.00.
 Trillion Dollar Coach: The Leadership Handbook of Silicon Valley’s Bill Campbell
Original price was: ₹599.00.₹439.00Current price is: ₹439.00.
SRI VENKATESHWARA SWAMI (TELUGU) by Srinivas Sevanand Das 2025 Hardbound
Original price was: ₹999.00.₹750.00Current price is: ₹750.00.
SRI VENKATESHWARA SWAMI (TELUGU) by Srinivas Sevanand Das 2025
Original price was: ₹399.00.₹250.00Current price is: ₹250.00.
Let's Talk Mutual Funds
Original price was: ₹399.00.₹319.00Current price is: ₹319.00.
Trillion Dollar Coach: The Leadership Handbook of Silicon Valley’s Bill Campbell
Original price was: ₹599.00.₹439.00Current price is: ₹439.00.
SRI VENKATESHWARA SWAMI (TELUGU) by Srinivas Sevanand Das 2025 Hardbound
Original price was: ₹999.00.₹750.00Current price is: ₹750.00.
SRI VENKATESHWARA SWAMI (TELUGU) by Srinivas Sevanand Das 2025
Original price was: ₹399.00.₹250.00Current price is: ₹250.00.
Let's Talk Mutual Funds
Original price was: ₹399.00.₹319.00Current price is: ₹319.00.
Reviews
There are no reviews yet.