Additional information
| Weight | 1 kg |
|---|---|
| Dimensions | 11 × 11 × 11 cm |
| Shipping Time | 1-2 weeks |
Original price was: ₹449.00.₹379.00Current price is: ₹379.00.
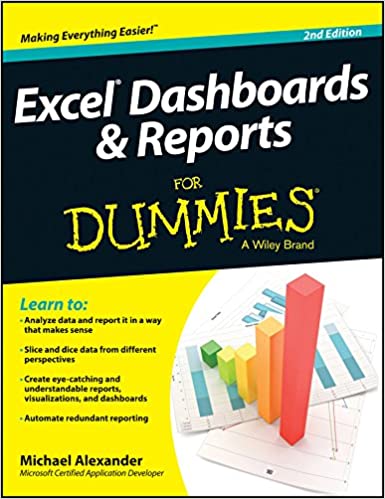
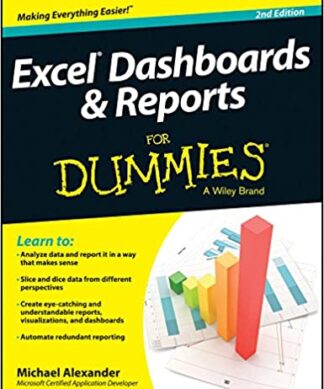
Large corporations like IBM and Oracle are using Excel dashboards and reports as a Business Intelligence tool, and many other smaller businesses are looking to these tools in order to cut costs for budgetary reasons. An effective analyst not only has to have the technical skills to use Excel in a productive manner, but must be able to synthesize data into a story, and then present that story to help make a decision. Microsoft shows its recognition of this need through Excel. In Excel, there is a major focus on business intelligence and visualization. Excel Dashboards and Reports For Dummies, 2nd Edition fills the gap between handling data and synthesizing data into meaningful reports. It offers quick and accessible information to show readers how to think about their data in ways other than columns and rows. What are the most meaningful ways to show trending? How do you show relationships in data? When is showing variances more valuable than showing actual data values? How do you deal with outliers? How do you bucket data in the most meaningful way? How do you show impossible amounts of data without inundating your audience? In Excel Reports and Dashboards For Dummies, 2nd Edition, readers will get answers to all of these questions. Part technical manual, part analytical guidebook, this title will help Excel users go from reporting data with simple tables full of dull numbers to creating hi-impact reports and dashboards. This book offers a comprehensive review of a wide array of technical and analytical concepts that will help users create meaningful reports and dashboards
| Weight | 1 kg |
|---|---|
| Dimensions | 11 × 11 × 11 cm |
| Shipping Time | 1-2 weeks |
Only logged in customers who have purchased this product may leave a review.

 Water Supply and Pollution Control 8e
Original price was: ₹899.00.₹719.00Current price is: ₹719.00.
Water Supply and Pollution Control 8e
Original price was: ₹899.00.₹719.00Current price is: ₹719.00.
 WHY THEY KILLED GANDHI
Original price was: ₹499.00.₹374.00Current price is: ₹374.00.
WHY THEY KILLED GANDHI
Original price was: ₹499.00.₹374.00Current price is: ₹374.00.
 Complete Vue.js 2 Web Development
Original price was: ₹3,499.00.₹3,498.00Current price is: ₹3,498.00.
Complete Vue.js 2 Web Development
Original price was: ₹3,499.00.₹3,498.00Current price is: ₹3,498.00.
 Building Data-Driven Applications with LlamaIndex: A practical guide to retrieval-augmented generation (RAG) to enhance LLM applications
Original price was: ₹3,399.00.₹2,549.00Current price is: ₹2,549.00.
Building Data-Driven Applications with LlamaIndex: A practical guide to retrieval-augmented generation (RAG) to enhance LLM applications
Original price was: ₹3,399.00.₹2,549.00Current price is: ₹2,549.00.
 Building an API Product: Design, implement, release, and maintain API products that meet user needs
Original price was: ₹3,099.00.₹2,324.00Current price is: ₹2,324.00.
Building an API Product: Design, implement, release, and maintain API products that meet user needs
Original price was: ₹3,099.00.₹2,324.00Current price is: ₹2,324.00.
 Building AI Applications with OpenAI APIs: Leverage ChatGPT, Whisper, and DALL-E APIs to build 10 innovative AI projects , Second Edition
 Building AI Applications with Microsoft Semantic Kernel : Easily integrate generative AI capabilities and copilot experiences into your applications
Building Data-Driven Applications with LlamaIndex: A practical guide to retrieval-augmented generation (RAG) to enhance LLM applications
Original price was: ₹3,399.00.₹2,549.00Current price is: ₹2,549.00.
Building an API Product: Design, implement, release, and maintain API products that meet user needs
Original price was: ₹3,099.00.₹2,324.00Current price is: ₹2,324.00.
Building AI Applications with OpenAI APIs: Leverage ChatGPT, Whisper, and DALL-E APIs to build 10 innovative AI projects , Second Edition
Building AI Applications with Microsoft Semantic Kernel : Easily integrate generative AI capabilities and copilot experiences into your applications
Building AI Applications with Microsoft Semantic Kernel : Easily integrate generative AI capabilities and copilot experiences into your applications
Building Data-Driven Applications with LlamaIndex: A practical guide to retrieval-augmented generation (RAG) to enhance LLM applications
Original price was: ₹3,399.00.₹2,549.00Current price is: ₹2,549.00.
Building an API Product: Design, implement, release, and maintain API products that meet user needs
Original price was: ₹3,099.00.₹2,324.00Current price is: ₹2,324.00.
Building AI Applications with OpenAI APIs: Leverage ChatGPT, Whisper, and DALL-E APIs to build 10 innovative AI projects , Second Edition
Building AI Applications with Microsoft Semantic Kernel : Easily integrate generative AI capabilities and copilot experiences into your applications
 Indistractable How to Control Your Attention and Choose Your Life Paperback – 20 Sep 2019
Original price was: ₹599.00.₹399.00Current price is: ₹399.00.
Indistractable How to Control Your Attention and Choose Your Life Paperback – 20 Sep 2019
Original price was: ₹599.00.₹399.00Current price is: ₹399.00.
 Loonshots: How to Nurture the Crazy Ideas That Win Wars, Cure Diseases, and Transform Industries Hardcover – 19 Mar 2019
Original price was: ₹599.00.₹429.00Current price is: ₹429.00.
Loonshots: How to Nurture the Crazy Ideas That Win Wars, Cure Diseases, and Transform Industries Hardcover – 19 Mar 2019
Original price was: ₹599.00.₹429.00Current price is: ₹429.00.
 Factfulness (English, Hardcover, Hans Rosling)
Original price was: ₹499.00.₹349.00Current price is: ₹349.00.
Factfulness (English, Hardcover, Hans Rosling)
Original price was: ₹499.00.₹349.00Current price is: ₹349.00.
 Trillion Dollar Coach: The Leadership Handbook of Silicon Valley’s Bill Campbell
Original price was: ₹599.00.₹439.00Current price is: ₹439.00.
Building Data-Driven Applications with LlamaIndex: A practical guide to retrieval-augmented generation (RAG) to enhance LLM applications
Original price was: ₹3,399.00.₹2,549.00Current price is: ₹2,549.00.
Building an API Product: Design, implement, release, and maintain API products that meet user needs
Original price was: ₹3,099.00.₹2,324.00Current price is: ₹2,324.00.
Building AI Applications with OpenAI APIs: Leverage ChatGPT, Whisper, and DALL-E APIs to build 10 innovative AI projects , Second Edition
Trillion Dollar Coach: The Leadership Handbook of Silicon Valley’s Bill Campbell
Original price was: ₹599.00.₹439.00Current price is: ₹439.00.
Building Data-Driven Applications with LlamaIndex: A practical guide to retrieval-augmented generation (RAG) to enhance LLM applications
Original price was: ₹3,399.00.₹2,549.00Current price is: ₹2,549.00.
Building an API Product: Design, implement, release, and maintain API products that meet user needs
Original price was: ₹3,099.00.₹2,324.00Current price is: ₹2,324.00.
Building AI Applications with OpenAI APIs: Leverage ChatGPT, Whisper, and DALL-E APIs to build 10 innovative AI projects , Second Edition
Notifications
Reviews
There are no reviews yet.